Motivation
Natural products are a major source of novel drugs, and with the rise of antibiotic resistance, there is an urgent need to discover new compounds. Genome mining enables the rapid identification of biosynthetic gene clusters (BGCs) responsible for natural product biosynthesis. Predicting the structures of the synthesized compounds is key to guiding their targeted discovery, but this requires detailed knowledge of the enzymatic reactions at each step of the biosynthetic pathway. While the core scaffold of many natural products can often be predicted from the initial biosynthetic steps, later tailoring modifications remain difficult to model due to the limited characterization of the enzymes involved. Reliable reaction prediction requires first gathering functional annotations and performing evolutionary analysis of these enzymes—only then can accurate computational predictions be made. In the absence of automated tools, this process becomes time-consuming. Although phylogenetic trees with functional annotations are occasionally published, reusing them directly is labor-intensive and technically challenging.
PhyloNaP addresses this gap by providing a centralized collection of annotated phylogenetic trees for enzymes involved in natural product biosynthesis.
Recent Updates
April 15, 2026
- Database update: number of datasets expanded from ~49,000 to ~51,000 - purly eukaryotic datasets added
- Now can sumbit gbk file (useful for analysing the whole cluster from antiSMASH)
- Fixed colour-based display for paralagous sequences
- Help page extended with #interpreting-results and #contributing
- Bootstrap values now correctly displayed
March 26, 2026
Database update: number of datasets expanded from ~18,500 to ~49,000
Now database have more datasets with more diverse sequences. You can read the details on the updated dataset generation pipeline here.- Rooting algoritm update: trees are rooted based on taxonomy, when possible (see "hyperling with details" for the updates
- Eggnog annotations added - now some sequences annotated with COG category and KEGG reaction
Interface update:
Updates for the tree visualization page:- Added an action card for a leaf/node, with options to:
- examine all the available annotations
- download annotations or sequences
- apply coloring annotations (to show sequences from the same gene cluster family / from the same cluster) - this is especially useful for large trees
- Updated tree rendering to display the root correctly
- Slight metadata display improvements
Updates of the tree placement page specifically
- For the node of placement - user can see the details of the placement by clicking on the node
- Improved the view of the clade of placement - now the brighter the color, the closest the placement; added the scale bar for better context
October 20, 2025
New Feature: Personal Tree Visualization
Users can now explore and analyze their own annotated phylogenetic trees directly in the PhyloNaP interface. This new functionality allows researchers to:
- Upload their own tree files (Newick format) along with metadata
- Visualize trees using the same interactive interface as the database entries
- Analyze clades using the “Get the summary of the clade” function
- If the annotation file includes a
MIBIGorMITEcolumn with valid IDs, corresponding molecular structures can also be displayed - Enjoy private browsing — uploaded trees and metadata are not stored on the server
Access this feature through the View page to start analyzing your phylogenetic data with PhyloNaP's advanced visualization tools.
1. Database Content Overview
What's in the Database
PhyloNaP's database contains comprehensive phylogenetic datasets for protein families involved in natural product biosynthesis. Each dataset includes:
- Phylogenetic tree with evolutionary model
- Sequence files in FASTA format
- Multiple sequence alignments
- Annotation files with functional data
- Optional elements: descriptions, superfamily classifications, reaction pathway images, and natural product structures
Database Composition
Curated Datasets (10)
High-quality, manually reviewed datasets from:
- Supplementary data or metadata from published articles
- Directly obtained from authors
- Provided by collaborators
Automated Datasets (~51,000)
Computationally generated phylogenetic trees covering:
- Broad enzyme family coverage
- Standardized quality control
- Consistent annotation pipeline
Database Generation Pipeline
Pipeline Overview
The dataset generation pipeline consists of a series of automated steps designed to collect, filter, and organize protein sequences into phylogenetically structured datasets.
A) Data Collection
Protein sequences were collected from four established resources:
- MiBiG 4.0 (Zdouc et al. 2024) — proteins from experimentally characterized biosynthetic gene clusters (BGCs)
- MITE (Zdouc et al. 2024) — enzymes with experimentally validated reactions
- antiSMASH-DB 4.0 (Blin et al. 2024) — predicted BGC-derived proteins from large-scale genome mining
- UniProt SwissProt (Boutet et al. 2007; The UniProt Consortium 2025) — manually curated sequences with high-quality functional data
B) Metadata Enrichment
Each sequence was enriched with metadata from multiple sources:
- Taxonomic information via the NCBI Datasets Taxonomy Data Package (O'Leary et al. 2024)
- Functional annotations, BGC product classes, and cross-links to external databases where available
- Structural data for substrates or products from MITE/MiBiG directly, or indirectly via UniProt cross-references to ChEBI (Hastings et al. 2016) and Rhea (Bansal et al. 2022); chemical structure depictions generated with RDKit (Landrum et al. 2020)
- antiSMASH-DB sequences additionally mapped to PanBGC (Paccagnella et al. 2025) to enable cross-referencing
- Dereplicated sequences (<70% identity) annotated with EggNOG and domains from the Superfamilies database
C) Sequence Clustering & Quality Filtering
Sequences were clustered using MMseqs2
easy-linclust
(Steinegger & Söding 2017) with minimal length 80 and
sensitivity 7.5 (most sensitive mode),
generating broad clusters with relatively high diversity.
Clusters were then filtered to remove only SwissProt entries (likely primary
metabolism)
D) Alignment, Tree Construction & Iterative Refinement
For each retained cluster:
- Alignment: Multiple sequence alignment with
MAFFT(auto mode) (Katoh & Standley 2013) - Trimming: Automatic trimming with
TrimAl(Capella-Gutiérrez et al. 2009) - Deduplication: Identical post-trimming sequences removed; unique
annotation information retained in
<column>_othersmetadata fields. Clusters with fewer than 10 sequences after this step are discarded. - Tree construction: Phylogenetic trees inferred with
FastTree(Price et al. 2010) - Iterative subclustering: Evolutionary diversity assessed with
TreeCluster(Balaban et al. 2019, PLoS ONE 14(8):e0221068) using a maximal evolutionary distance threshold of 4. Trees exceeding this threshold are subclustered; each subcluster is then independently realigned, trimmed, deduplicated, and phylogenetic tree inferred.
E) Alignment Quality Control
After iterative refinement, alignment quality is assessed using two criteria:
- Alignment length retention = length of trimmed alignment / mean(length of protein sequences). Datasets with a value <75 are discarded.
- AliStat completeness metrics: datasets with row completeness Cr < 0.7 (median fraction of non-empty symbols per row) or low overall completeness Ca are discarded.
F) Tree Rooting
Trees are rooted using one of two approaches:
- MADroot (Bryant & Charleston 2018) — minimal ancestor deviation rooting applied by default
- Taxonomy-based rooting — a custom algorithm applied when a taxonomically divergent outgroup clade is detected (applied to ~68% of datasets)
Quality Assurance
Each step includes quality control measures — sequence filtering, alignment completeness checks, and tree quality assessment — to ensure reliable phylogenetic reconstructions and meaningful functional predictions.
Database Navigation
Users can efficiently explore the database using multiple filtering and sorting options:

- HMM name: Focus on specific enzyme families
- Source Distinguishes manually generated and annotated datasers and those generated by PhyloNaP pipeline
- Data type The automatic pipeline include only full proteins, but we kept an option for long multidomain proteins to load the datasets on specific domains
- N of sequences: The overall dataset size
- N of characterized: Number of proteins with known reaction (Proteins sourced from SwissProt+having Rhea number or from MITE)
- N of validated NP: Number of proteins from BGC, synthesizing characterized natural product (an entry from MiBiG)
- N of predicted NP: Number of proteins from predicted BGC (antiSMASHdb)
2. Examining Phylogenetic Tree Pages
Interactive Tree Visualization
PhyloNaP provides powerful interactive tools for exploring phylogenetic relationships and functional annotations. Each tree page combines evolutionary context with biochemical information to facilitate enzyme function prediction.
Explore the Tree
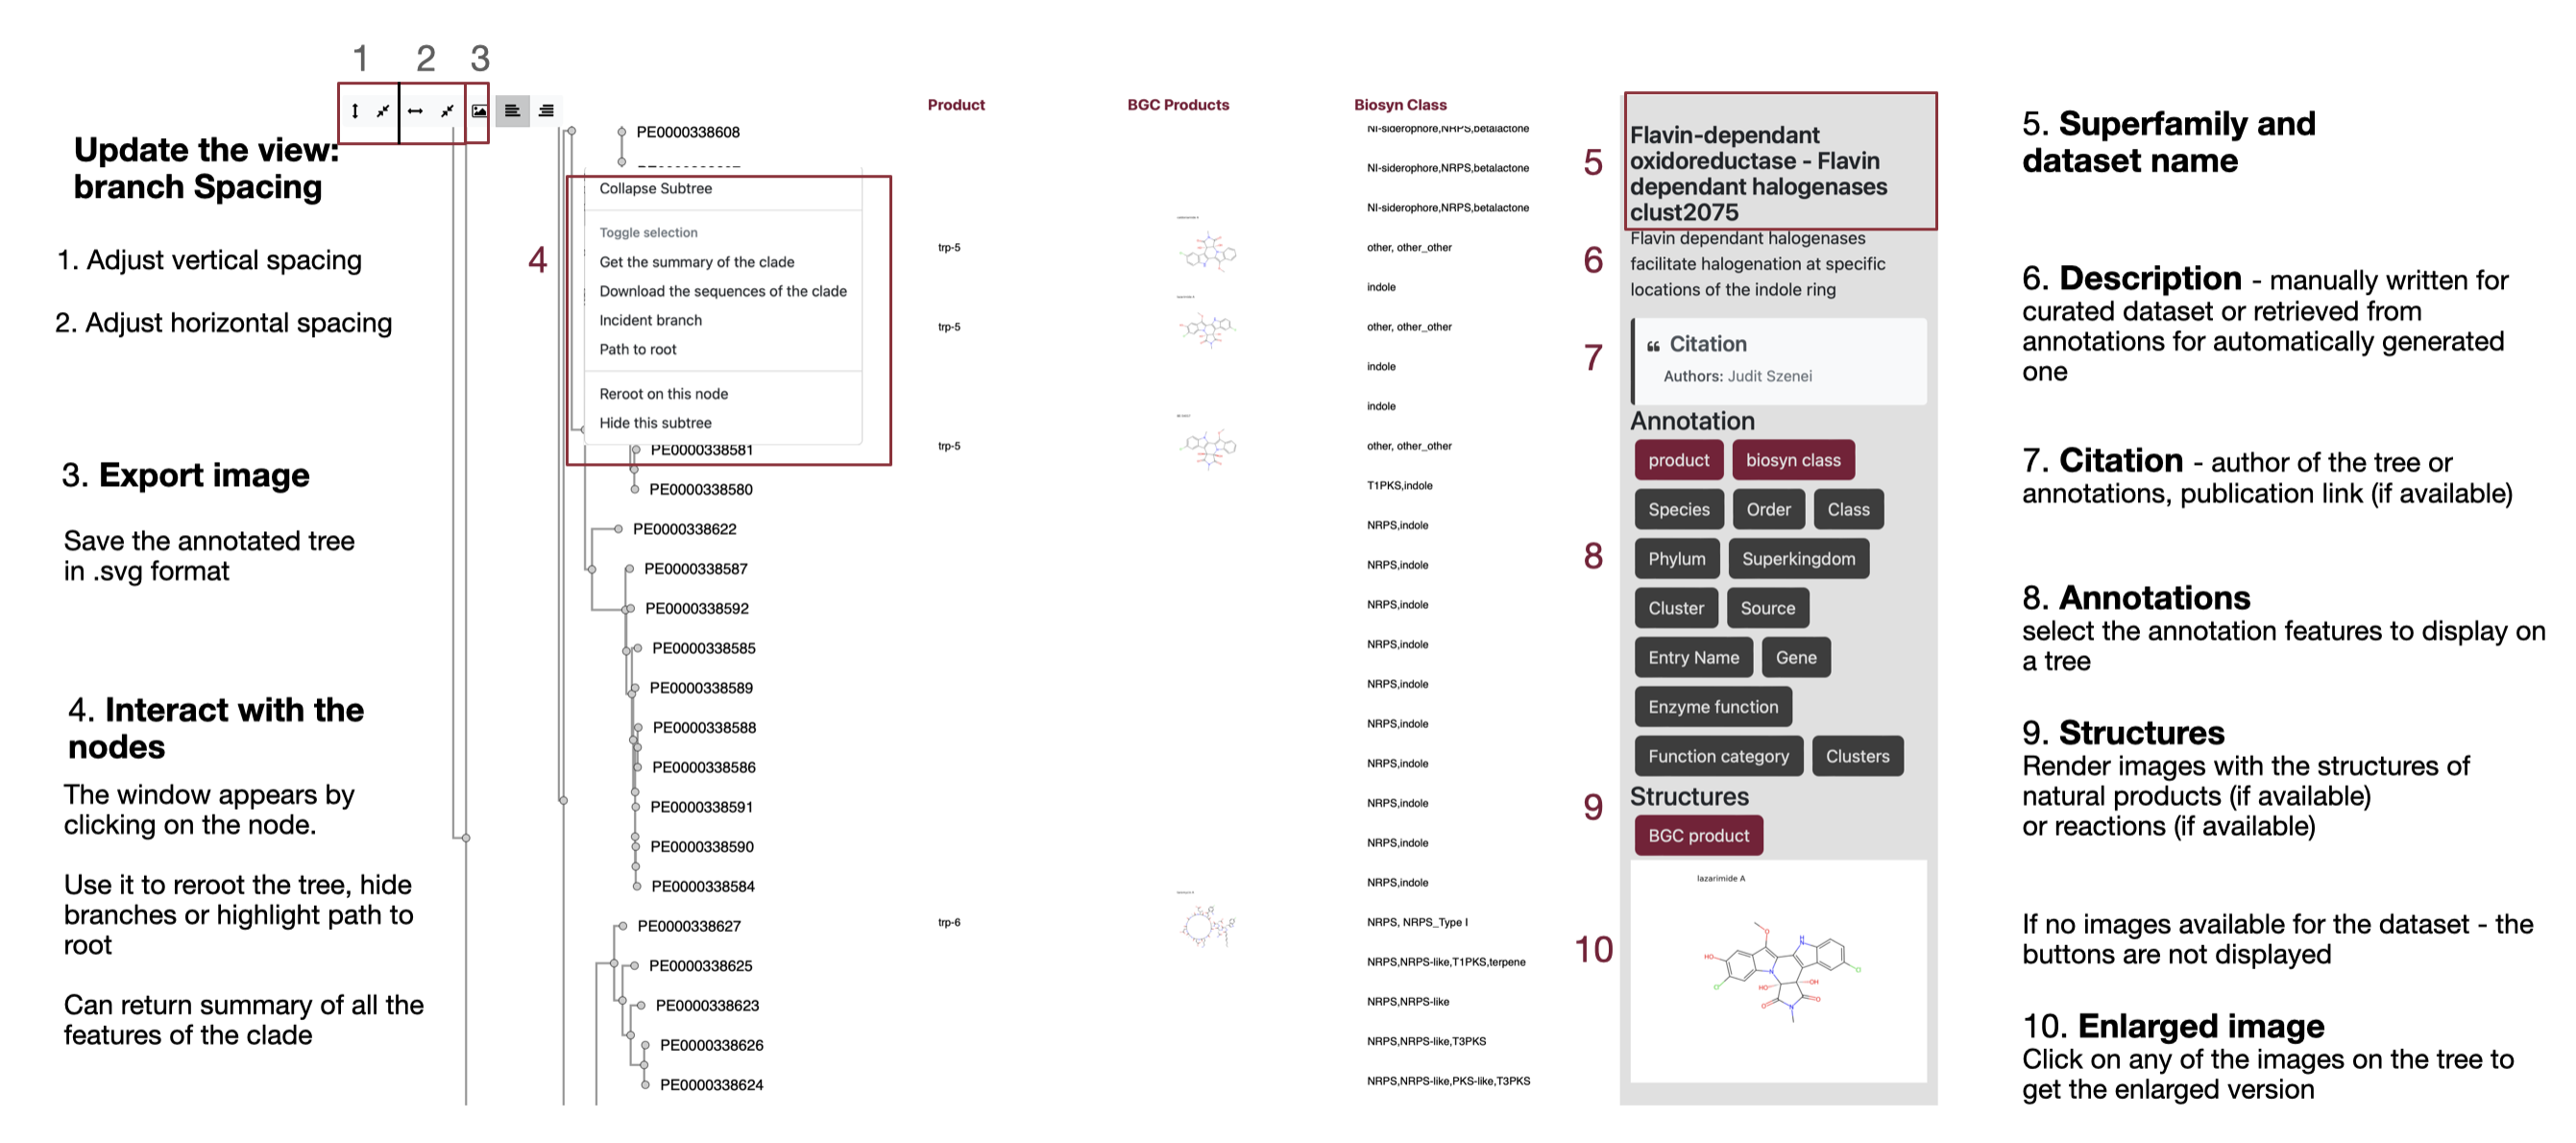
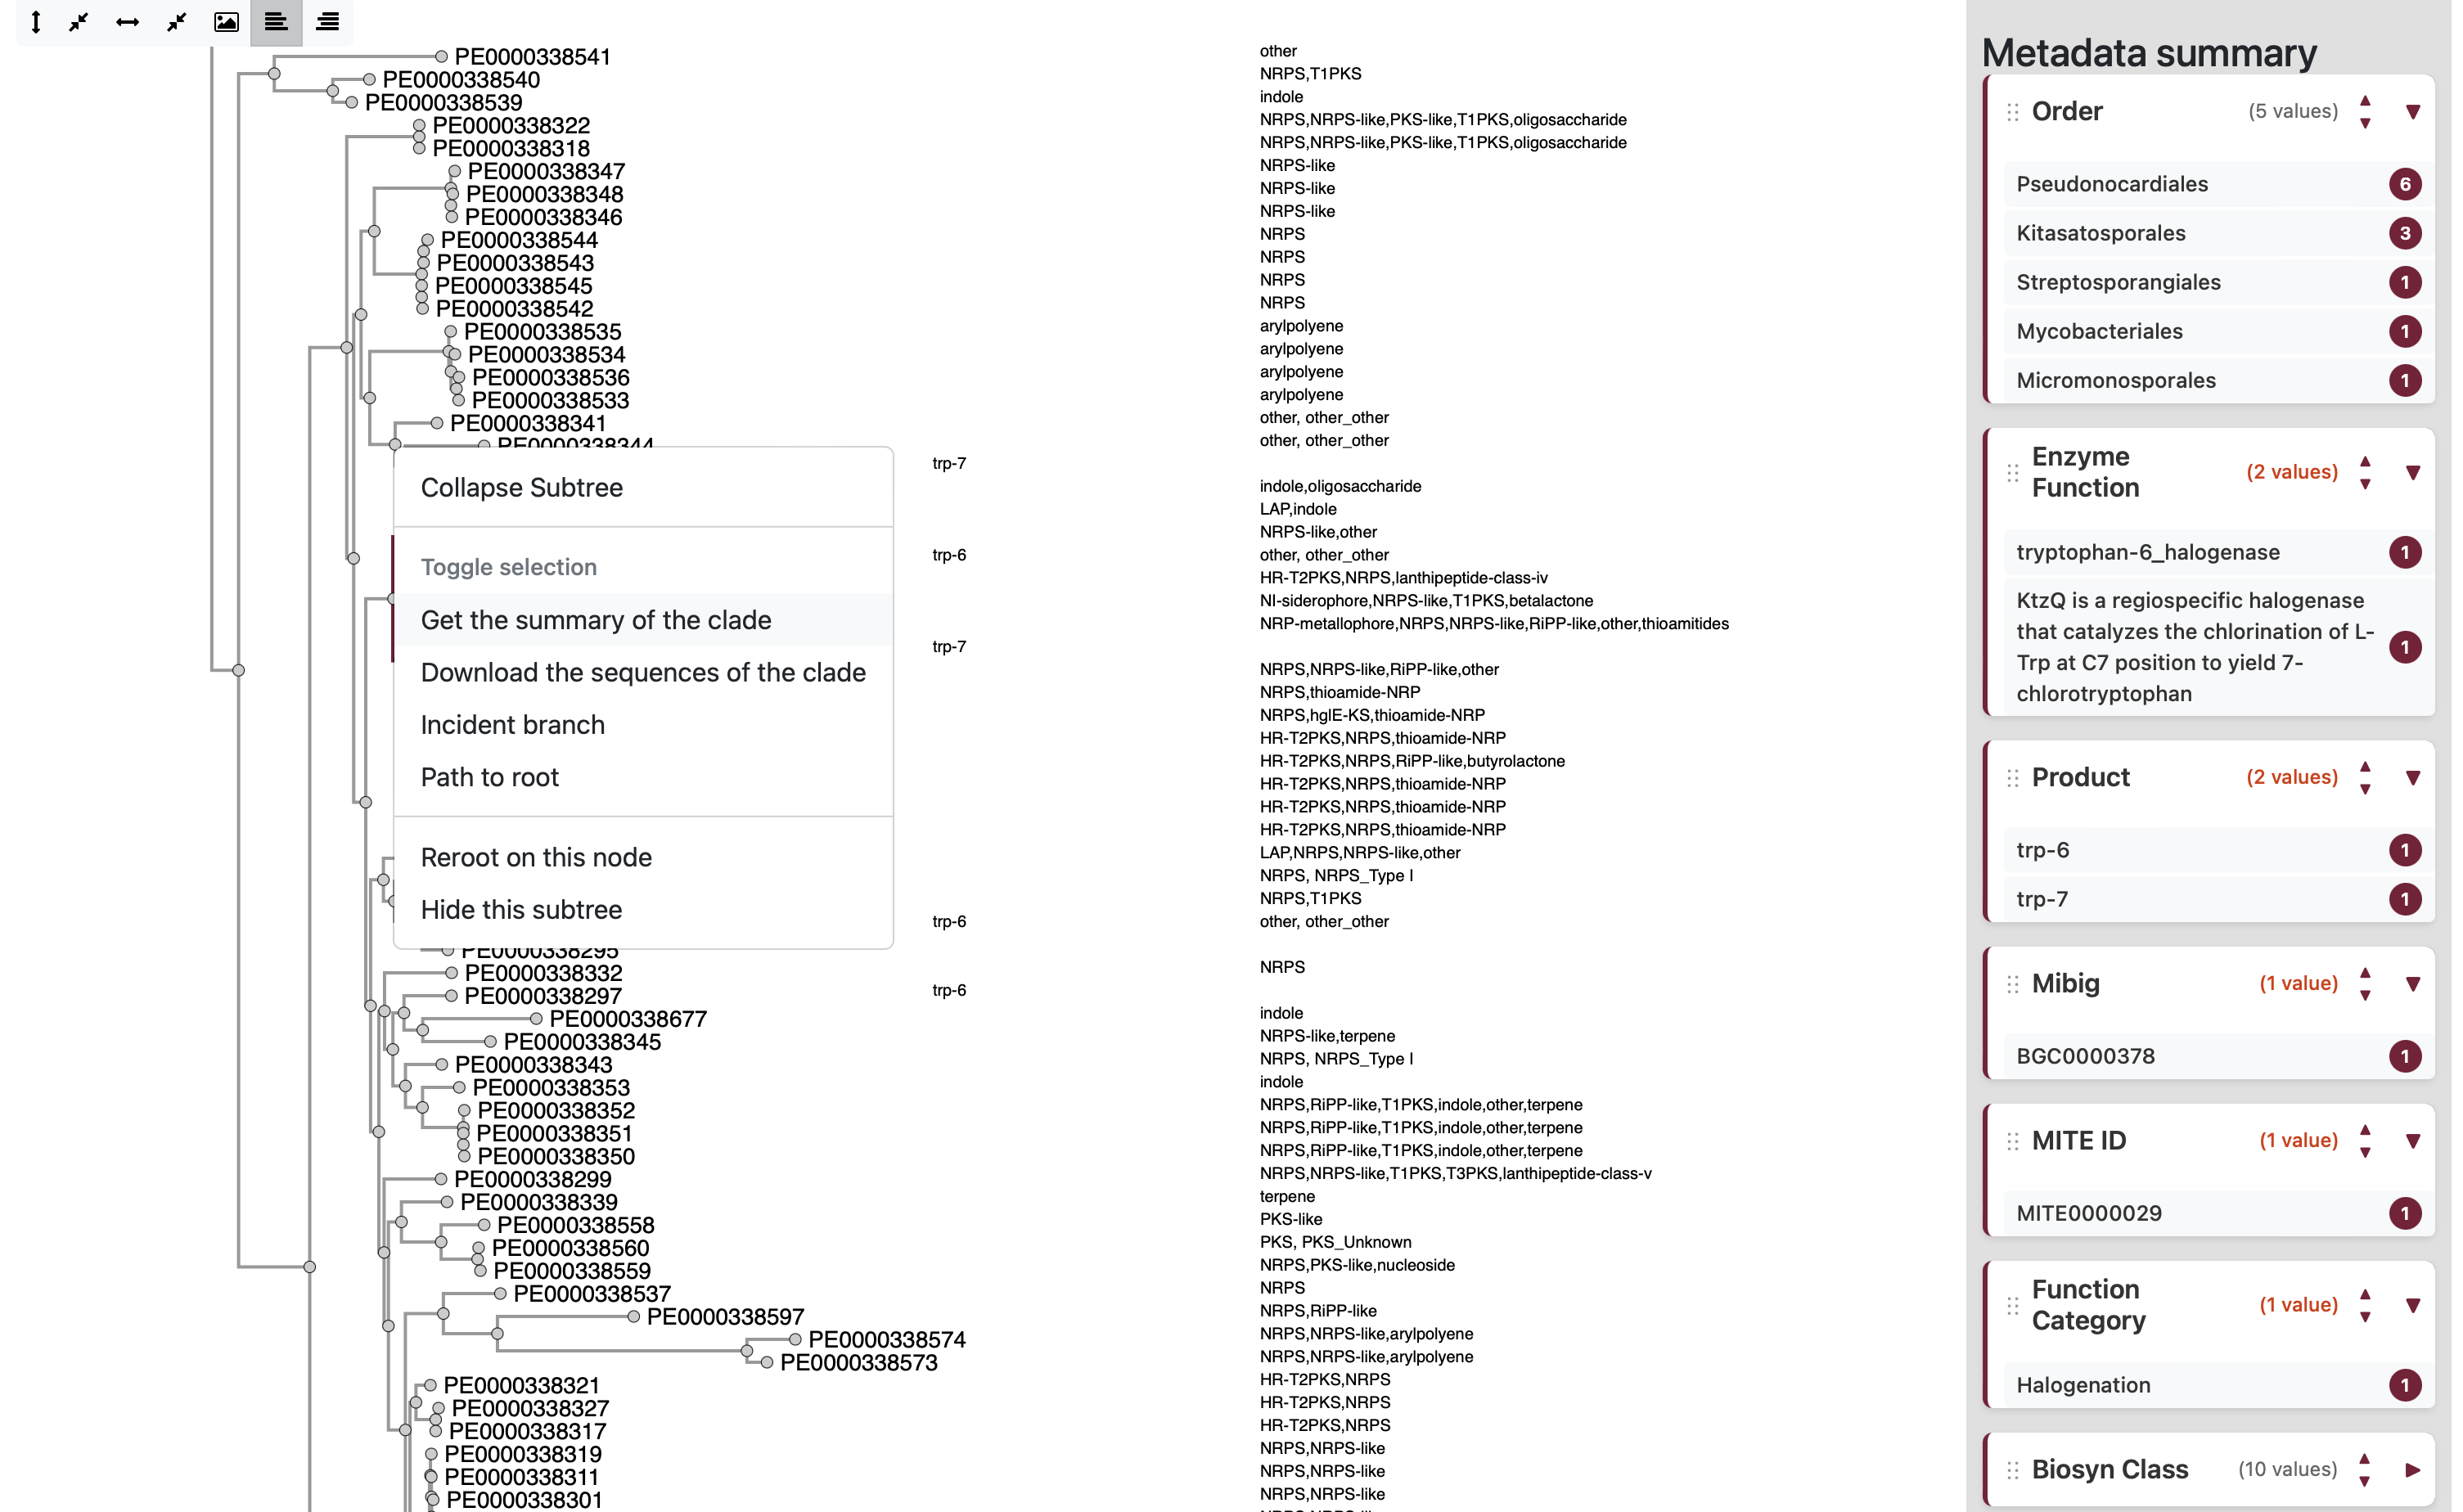
Summary of the clade feature
When you click on a node and select "Get the summary of the clade", a metadata summary is displayed. This summary shows all features associated with the selected node, and the descendant branches of that node will be highlighted in color.
By default, the features are sorted from those with the most identical values to those with the greatest diversity. However, users can adjust the sorting order manually using the arrow buttons. :
3. Enzyme Classification & Protein Placement
Protein Placement Pipeline Overview
PhyloNaP enables users to classify their protein sequences by placing them onto curated phylogenetic trees using a robust, multi-step computational pipeline.
Input Format
- Submit one or multiple protein sequences in FASTA format.
Similarity Search
- Each query is searched against a non-redundant PhyloNaP protein database using MMseqs2.
- The non-redundant set is built by aggregating all proteins and filtering out those with >70% similarity.
- Search thresholds:
- ≥ 30% sequence identity
- ≥ 50% alignment coverage
Placement Procedure
- For each query with hits, the associated dataset is retrieved.
- The query is aligned to the reference multiple sequence alignment used for the tree.
- The combined alignment is submitted to EPA-ng for placement onto the existing phylogenetic tree.
EPA-ng Placement Details
- EPA-ng uses the reference tree’s evolutionary model to generate a new tree from the extended alignment.
- It compares the new topology with the original to determine the most likely placement(s).
- Each placement includes:
- Placement position (clade or node)
- Branch lengths
- Likelihood weight ratio (LWR): Statistical confidence of placement (range 0–1). For queries with multiple placements, all LWRs sum to 1.0. Higher values indicate more reliable placements.
- Note: A query may be placed in multiple locations, especially if it is distant from known clades or tree topology changes significantly, indicating higher uncertainty.
Understanding Branch Length & Placement Quality
Each placement features a pendant length—the branch connecting the query to the placement node/leaf.
- A long pendant length suggests greater evolutionary distance from the placement clade.
- This may indicate the query is not well represented by the clade’s features; interpret with caution.
Results Table

- Displays all matching datasets.
- Shows the Likelihood weight ratio (LWR)—the statistical confidence of each placement.
- If a query matches multiple trees, only the placement with the shortest pendant length is shown by default.
- You can toggle to display all alternative placements.
- Datasets are highlighted in red when the best placement has a pendant length > 1.
Tree Visualization
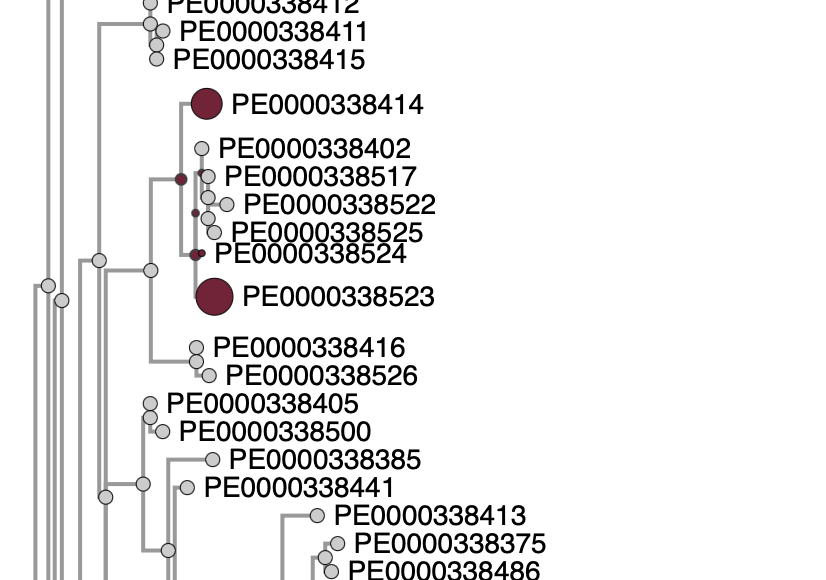
- Placements are shown as colored circles (dots) on the phylogenetic tree.
- Circle size reflects the relative likelihood of each placement.
- If there is one dominant placement, only that is shown by default; others can be revealed by clicking "Show all placements".
Interpreting Placement Results on the Tree
When your sequence is placed onto a reference tree, the result is shown as one or more colored dots. Here is how to read them:
Dot Color — Evolutionary Distance
The color of each dot reflects the pendant length (evolutionary distance between your query and the placement node). A color scale is shown at the top of the tree view: brighter and more saturated dots indicate shorter evolutionary distance, while pale or faded dots indicate greater distance. The table below summarises how pendant length values relate to placement reliability:
| Pendant length | Interpretation |
|---|---|
| < 0.1 | Very short evolutionary distance — close homolog; functional inference is likely reliable. |
| 0.1 – 0.2 | Short evolutionary distance — likely related, but minor functional differences are possible. |
| 0.2 – 0.5 | Substantial evolutionary distance — use caution when assigning specific function; broad functional class may still be informative. |
| 0.5 – 1.0 | Very large evolutionary distance — avoid direct functional extrapolation; use only for broad phylogenetic context or exploratory interpretation. |
Dot Size — Likelihood Weight Ratio (LWR)
When multiple placements are identified, the relative size of each dot reflects its Likelihood Weight Ratio (LWR):
- Larger dots = higher LWR = more probable placement location
- Smaller dots = lower LWR = less probable alternative placement
- All LWR values for a query within a tree sum up to 1.0
Click on a Dot for Details
Clicking on any placement dot displays the exact LWR and pendant length values — no need to search for placement IDs manually.
Important: LWR ≠ Placement Quality
The Likelihood Weight Ratio reflects the relative probability of each placement within the tree. If there is only one placement, the LWR will be 1.0 by definition — this does not mean the sequence is a close match to the reference clade.
To assess placement quality, always check the pendant length (evolutionary distance). A long pendant length means the query is distant from the reference sequences, even if LWR is high. The dot color provides this information at a glance: brighter = closer, paler = more distant.
Multiple Placements
A query may have multiple placements when the algorithm finds several equally likely positions. This often happens when the query is distant from the known sequences, or when the tree topology is ambiguous. In such cases, focus on the largest dot (highest LWR) and verify the pendant length. You can toggle between showing only the best placement and all placements using the controls in the Placements panel.
4. View Page
The View page allows you to visualize your own phylogenetic tree and metadata interactively — without submitting anything to the server. All processing happens entirely in your browser.
What You Can Do
- Upload a phylogenetic tree (Newick format) together with a metadata table and, optionally, a sequence alignment
- Explore the tree interactively: zoom, pan, reroot, collapse clades
- Color and annotate leaves using any column from your metadata
- Check that your data is formatted correctly before contributing it to PhyloNaP
Privacy note: Your files are read by the browser and never sent to our servers. The viewer uses the same rendering engine as the main PhyloNaP database pages, so what you see is exactly how the dataset would look after submission.
Tip: Use the View page to verify your data before going to Contribute.
5. Contributing a Dataset
PhyloNaP welcomes community contributions of curated phylogenetic datasets, particularly those derived from published studies. These datasets are essential for improving coverage and annotation quality across enzyme families. Submissions can be made via the Contribute page.
General Recommendations
We strongly encourage submissions based on published phylogenetic analyses, which may be included in their original form to preserve reproducibility. We also welcome newly constructed phylogenies for enzyme families not yet represented in PhyloNaP. All submissions are subject to basic quality checks (e.g., alignment consistency, identifier matching, and completeness of metadata) prior to inclusion.
Submission Data
| Item | Details | Status |
|---|---|---|
| Phylogenetic tree | Newick format (.nwk, .newick, .tree, .contree) |
Required |
| Alignment | The multiple sequence alignment used to build the tree, in FASTA format (.fasta, .fa) |
Required |
| Annotation table | TSV or CSV with an ID column whose values match the leaf labels in the tree and alignment. Additional columns (e.g., function, organism, product class) will appear as metadata on the tree | Required |
| Dataset name | A short, descriptive name for the dataset | Required |
| Description | A brief description of the dataset (enzyme family, scope, organism range, etc.) | Required |
| Evolutionary model | The substitution model used for tree inference (e.g., LG+F+I+R4, WAG+I+G4). For IQ-TREE users: upload the .iqtree file and the model is extracted automatically. Important for placement accuracy |
Recommended |
| Alignment type | Select Full sequence or Domain. If your dataset is based on individual protein domains or heavily trimmed sequences, mark it as "Domain" — this affects placement interpretation and functional inference | Recommended |
| Author & publication | Name(s) of the tree author(s) and/or a DOI or reference to the associated publication | Optional |
| SMILES strings | Include substrate or product structures as a column in the annotation table. They will be used to render chemical structure images on the tree | Optional |
| Molecule images | Upload images of substrates, products, or reactions (PNG/JPG). Filenames should contain the matching leaf ID. For >100 images, use a .zip archive. Images will be stored in the database and displayed on the tree |
Optional |
Quality Guidelines for Phylogenetic Trees
To ensure reliability and interpretability of contributed datasets, we ask authors to follow these recommendations where possible.
Sequence Alignment
Alignments should be of high quality, without extensive regions of ambiguous alignment or excessive gaps.
Alignment Trimming
Trimming is recommended to remove poorly aligned or highly gapped regions that may introduce noise into tree reconstruction. At the same time, care should be taken to preserve informative positions and avoid excessive trimming that reduces phylogenetic signal. As a general principle, alignments should retain sufficient length and information content relative to the underlying protein sequences.
Tree Inference Methods
We recommend maximum likelihood (ML) or similarly robust methods for tree inference. Neighbor-joining (NJ) trees are generally less reliable and are primarily accepted when derived from published studies.
Branch Support
Inclusion of branch support values (e.g., bootstrap or SH-like support) is strongly encouraged, as it helps users assess the reliability of individual clades.
Evolutionary Model
Please provide the substitution model used for tree inference. For IQ-TREE, submission
of the corresponding .iqtree file is recommended, as the model is
extracted automatically and improves placement accuracy.
Rooting
Rooting is essential for the placement algorithm to work correctly. Please ensure that your tree is rooted before submission. If the rooting method is known (e.g., outgroup, midpoint, MAD), including that information is appreciated.
Domain-Based Datasets
If your dataset is based on protein domains or heavily trimmed sequences rather than full-length proteins, please indicate this by selecting "Domain" as the alignment type. This distinction is important because domain-based trees may affect placement interpretation and functional inference.
Consistency Is Key
The most common issue with submissions is mismatched identifiers.
Make sure the IDs in your annotation table match those in the tree and alignment
files exactly (including case and any version suffixes such as .1).
Use the View page to preview your data
and catch formatting problems before submitting.
About, Contact & Legal
How to Cite
PhyloNaP: a user-friendly database of Phylogeny for Natural Product–producing enzymes
Aleksandra Korenskaia, Judit Szenei, Lisa Vader, Kai Blin, Tilmann Weber, Nadine Ziemert
bioRxiv 2025.09.23.677986 · doi: 10.1101/2025.09.23.677986
Local Deployment
PhyloNaP can be self-hosted using the source code on GitHub:
ZiemertLab/PhyloNaP_WebAppIncludes Docker support and setup instructions.
Contact
For questions, feedback, or collaboration inquiries:
aleksandra.korenskaia@uni-tuebingen.de
Ziemert Lab, University of Tübingen, Germany
Funding
This project has received funding from the European Union's Horizon Europe programme under the Marie Skłodowska-Curie grant agreement No 101072485.
Legal
License
Released under the MIT License. Free to use for academic and commercial purposes.
Data Privacy
- Submitted sequences are processed temporarily
- Job results are kept for 30 days
- An optional email address may be provided for job notifications
- IP addresses are recorded in server logs for error diagnostics only and are not used for tracking or profiling
Cookies & Tracking
This site uses only essential session cookies. No analytics or third-party tracking is used. Full disclaimer →